Imagine you are tied to a chair in a dark room and 5 flashlights shine to your face continuously. With great difficulty, you try to identify who is holding them. Nevertheless, the lights come close to each other to make a single bright flash, blinding your eyes making it impossible to view anything other than the white blur.


Limit of optical diffraction
As any scientist, you were tied to the chair of resolution. Resolution in microscopy is defined as the minimum distance between two points on a specimen that can be still distinguished as two distinct points by the observer or the system for observation.
Scientists were always fascinated by two things, i.e. to explore the furthest of space and to observe the smallest of matter. With the optical microscope, this fascination became a frustration after a certain limit, the limit of optical diffraction.
The resolution of an optical microscope is limited as discovered by Ernst Karl Abbe in 1873, which was put into the equation,
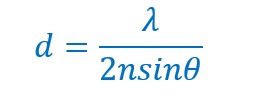
, where n is the refractive index of the medium, λ represents the wavelength of light.
The numerical aperture of the microscope (NA) is equal to nsinθ. The numerical aperture is more like the hole in the objective lens which collects light. Light travels as waves, which makes it impossible for the lens to concentrate it entirely on a single point. Rather, it is spread out to form a disk of diameter about 200 nm on the focal plane. Hence, all the features of interest in that area will light up, giving the combined bright flash like that of the flashlights.
Fluorescence Microscopy
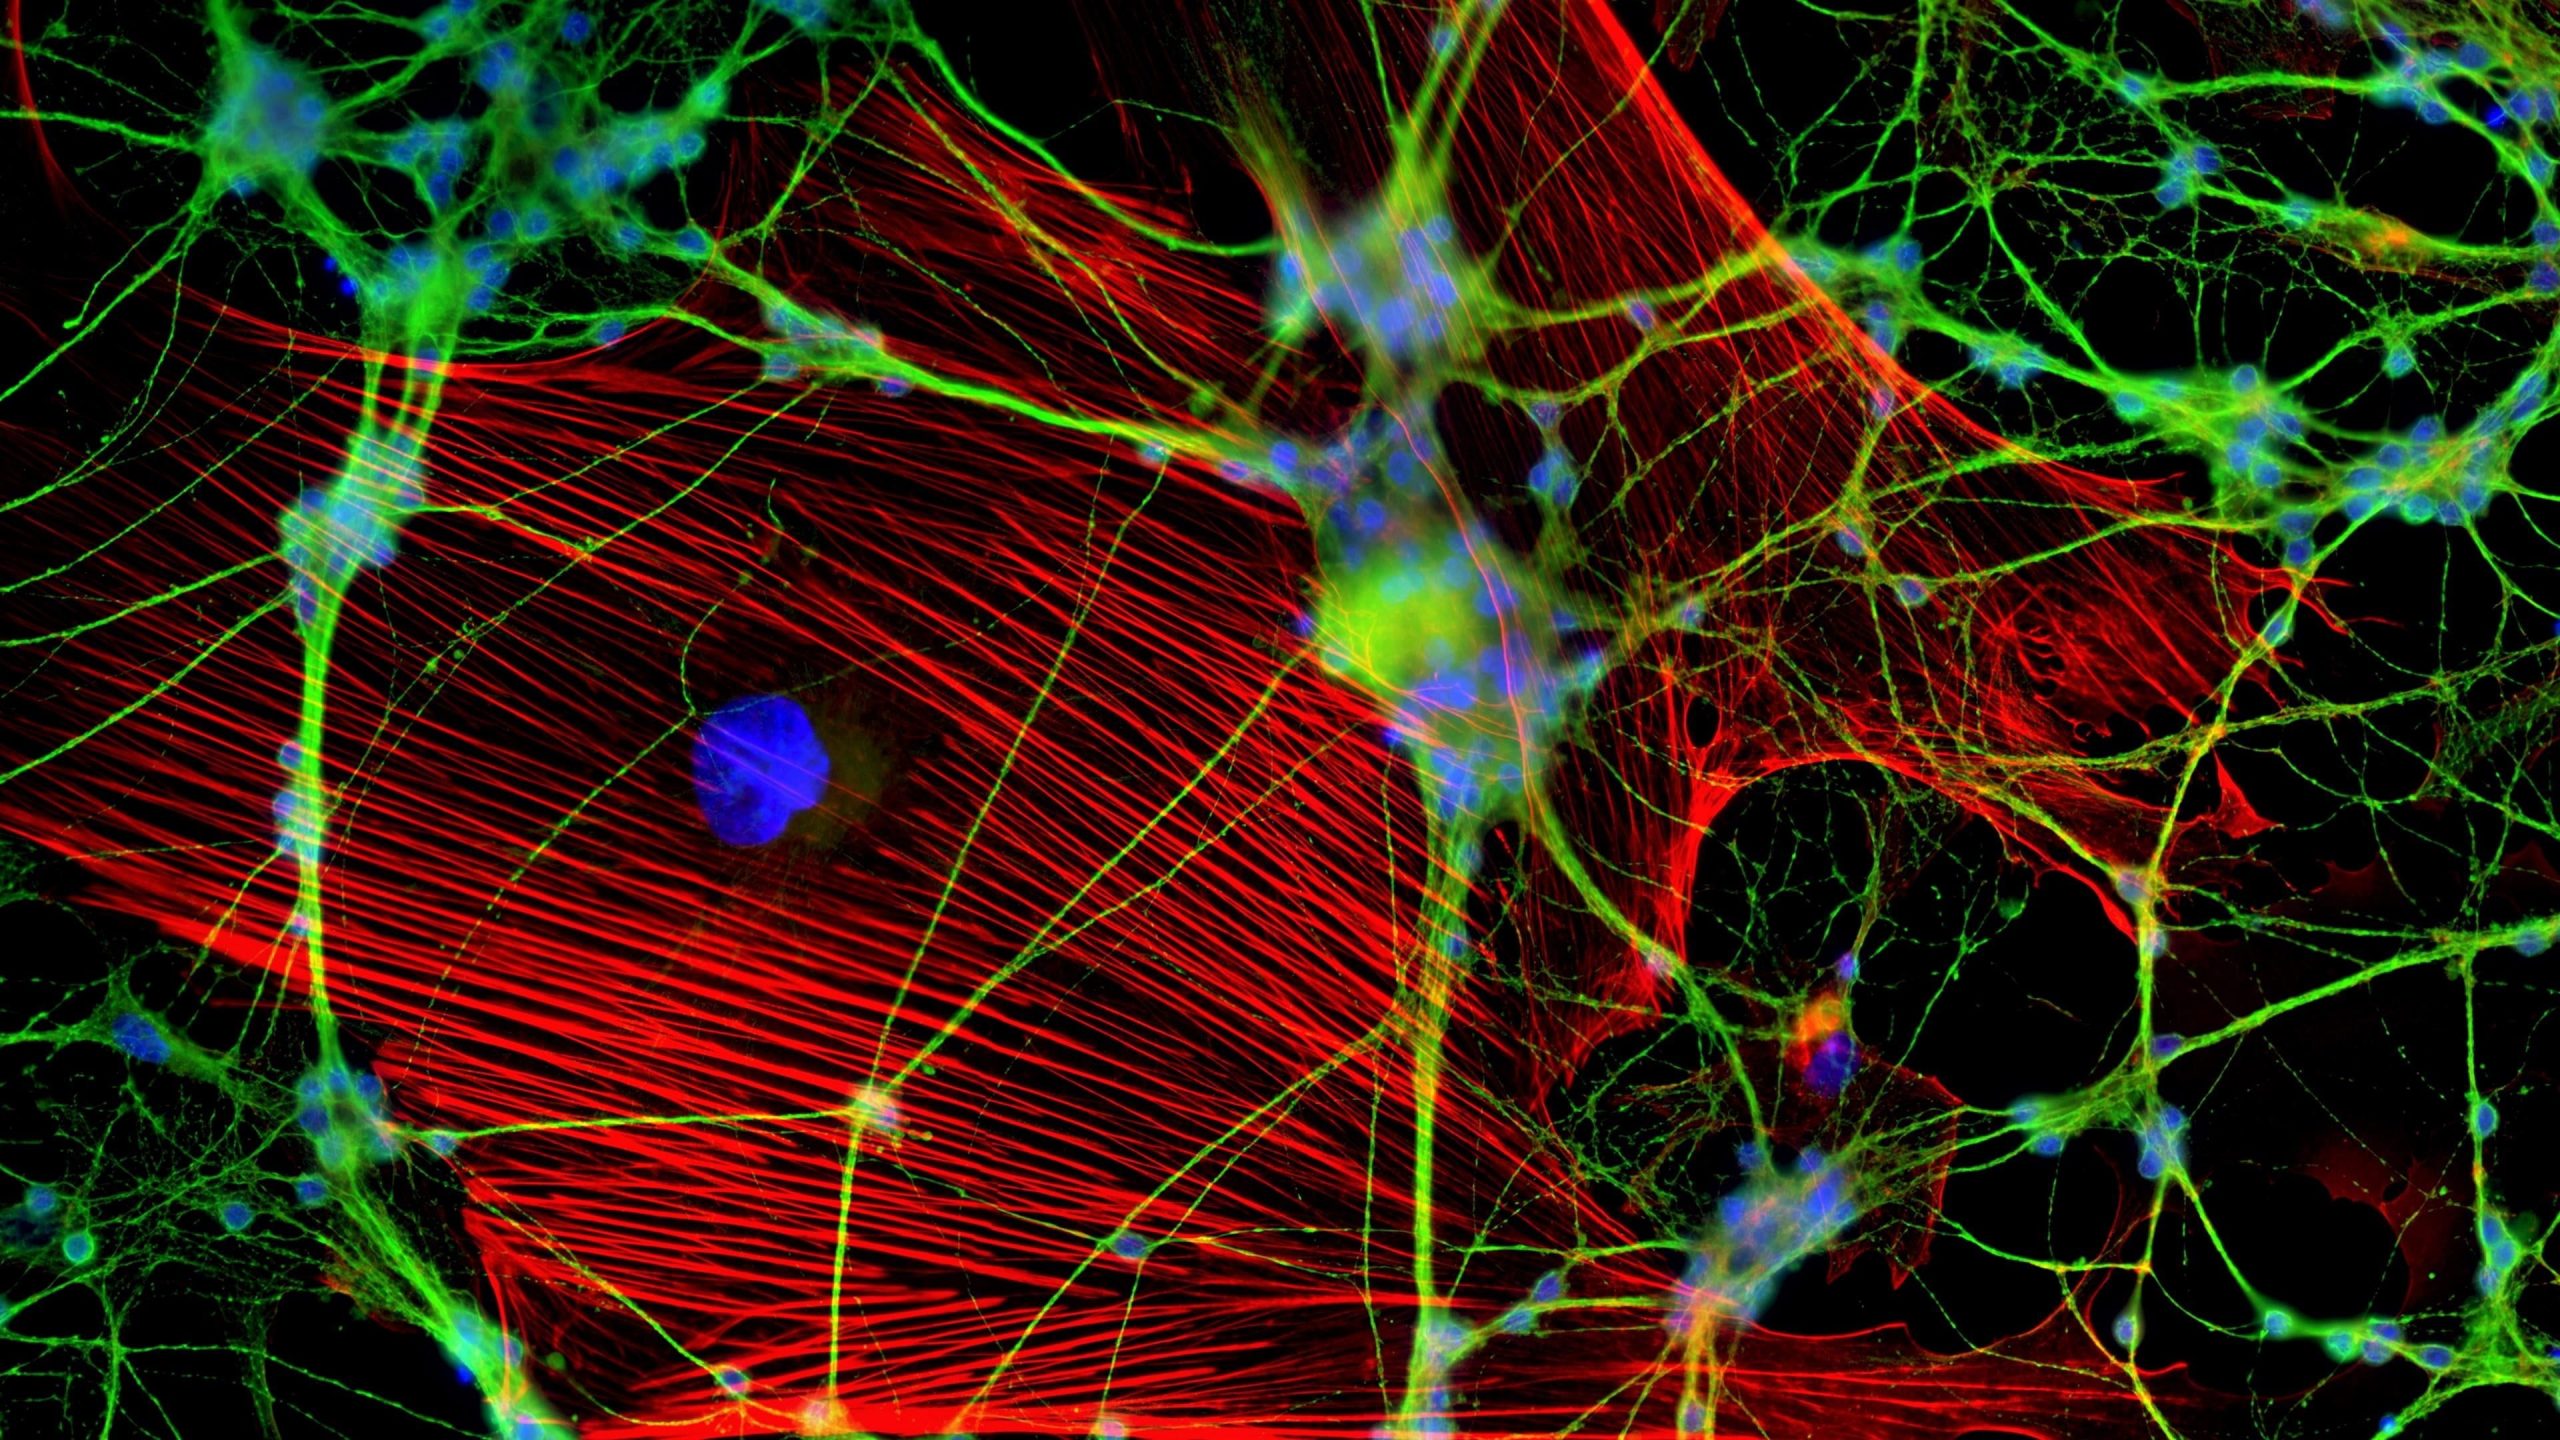
Fluorescence microscopy uses fluorescent dyes added to the specimen where fluorophores (fluorescence molecules) in the sample will be illuminated with the correct absorption spectrum wavelengths. The emitted light is then detected to acquire a two-dimensional image. Here the light emitted from out-of-focus areas cannot be separated from the light emitted from the in-focus areas.
Nevertheless, the microscope cannot focus light to a spot smaller than the diameter (equation), 200 nm zone. All the features in that area will fluorescence at the same time making it difficult to differentiate them apart from each other.
STED
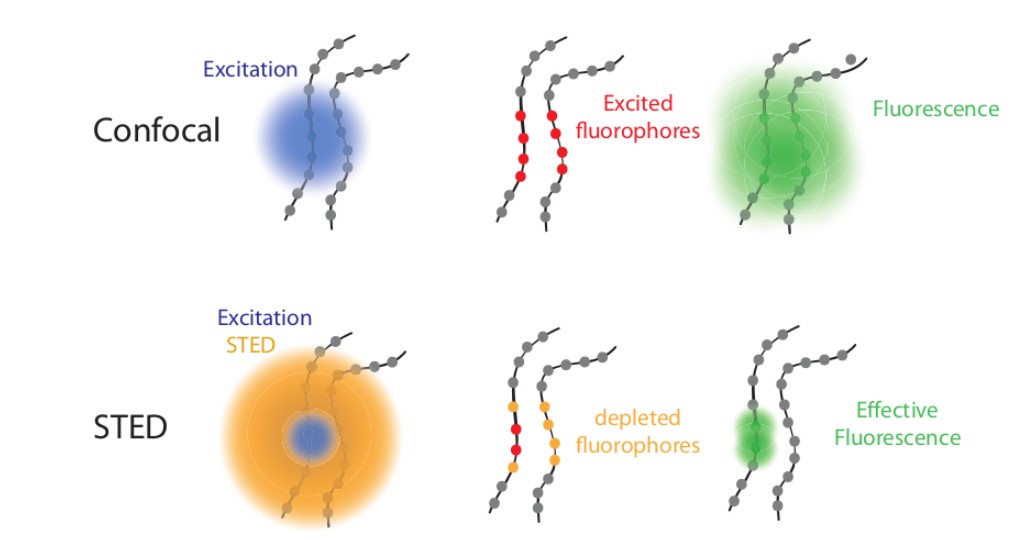
Overcoming the optical diffraction limit, Stimulated Emission Depletion (STED) microscopy was invented, which was first described by Stefan Hell who won the Nobel Prize in Chemistry in 2014. Hell’s idea was presented as the concept of depleting the florescent molecules around a single fluorescent area less than the diameter of the 200 nm zone. This was done by a laser (STED-laser) which was red-shifted, hence a higher wavelength, where the first laser with a low wavelength was used for initial fluorescence.
In detail, the first laser sent excites the fluorophores to a higher energy level by the absorption of energy of the first laser. This is called stimulated absorption. If the fluorophore falls back to the lower energy level, it releases the energy or the wavelength of light absorbed. This is known as spontaneous emission.
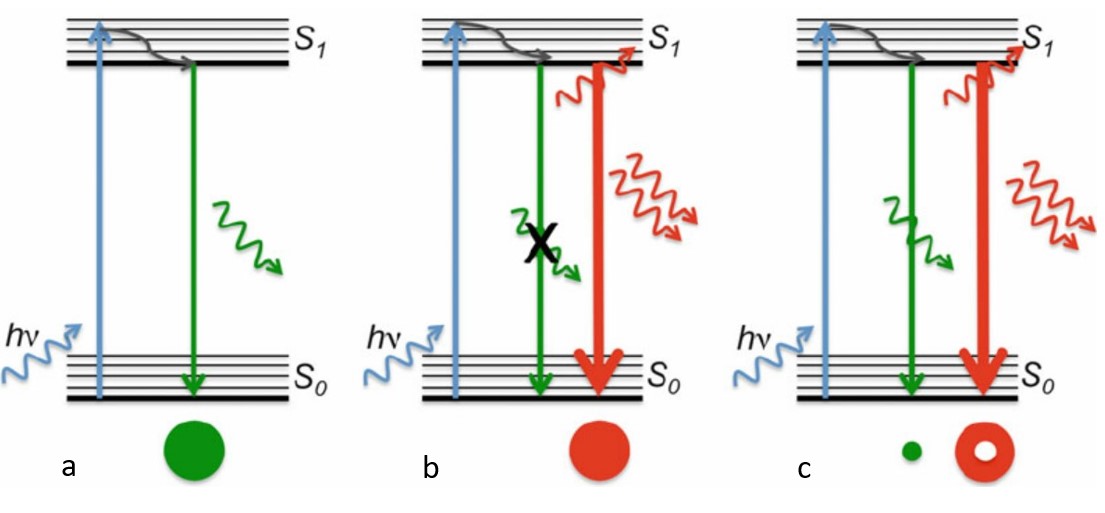
If the fluorophores are already in the excited state, with the advent of another wave of light, they will fall back (relax) to the ground state by emitting a photon of energy exactly to the same energy of the other wave of light (The second laser). The second laser (STED laser) has the shape of a donut where the zone within the hole will not be subjected to stimulated emission, but spontaneous emission. That is because only the first laser falls in that region, whereas the light from both the lasers overlaps in the area apart from the hole. In other words, the stimulated emission blocks the fluorophores in the overlapping region of the two lasers making only the non-overlapping region fluoresce.

With this development, the equation of Abbe was modified as follows.
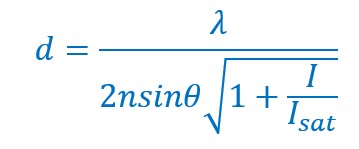
Here I represent the intracavity intensity and Isat represents the saturation intensity.

The fluorophores in the regions where both lasers overlap are not actually turned off. They too emit the stimulated emission wavelength which is later blocked in the emission pathway with a suitable filter, while the fluorescent photons from the region of the hole can reach the detector. (Blocking red, letting in green).
Deconvolution
This method eventually reduces the diameter to a range of 50 nm allowing super-resolution imaging. With the increase in optical resolution, many fluorophores will be depleted with the effect of the depletion laser, causing the lowering intensity of the image creating more noise. With the process of deconvolution, the noise in the image was significantly reduced increasing its contrast. This was achieved with the Huygens software which was further developed to achieve twice the resolution in both lateral and axial directions.
A donut-shaped laser beam has made a revolutionary breakthrough in microscopy and spectroscopy, allowing visibility of structures of processes like the movement of neurons and even structures of clustered proteins. Even though it’s the hole in the donut that you are focusing on, you are looking at the whole donut.
It’s just not visible always.
Image Credits:
- Featured Image: https://bit.ly/3huzeiT
- Fig.1: https://bit.ly/3uCvEqh
- Fig.2: https://bit.ly/3vXGh7v
- Fig.3: https://bit.ly/3uPryeV
- Fig.4: https://bit.ly/3hl2KY2
- Fig.5: https://bit.ly/2R8tuAp
- Fig.6: https://bit.ly/3f9LPoH
- Fig.7: https://bit.ly/3vWnAkx
- Fig.8: https://bit.ly/3eB4ISt
- Video: https://svi.nl/Deconvolution-algorithms
References:
- https://svi.nl/STED-Microscopy
- Hacking the optical diffraction limit: Review on recent developments
of fluorescence nanoscopy DING YiChen, XI Peng* & REN Qiushi Department of Biomedical Engineering, College of Engineering, Peking University, Beijing 100871, China Received January 8, 2011; accepted February 25, 2011; published online May 12, 2011.