This is the second section of the raspberry pi weather station project. How to set up the Raspbian operating system and proxy settings are included in the section one. The main concern in section two is to give an idea about the General Purpose Input / Output ports (GPIO) in Raspberry pi. This section consists of –
- How to interface an LED
- How to interface a push button
- How to interface a temperature sensor to the raspberry pi
Raspberry pi consists of several GPIO pins. The following diagram shows the power and GPIO pins on the Raspberry pi
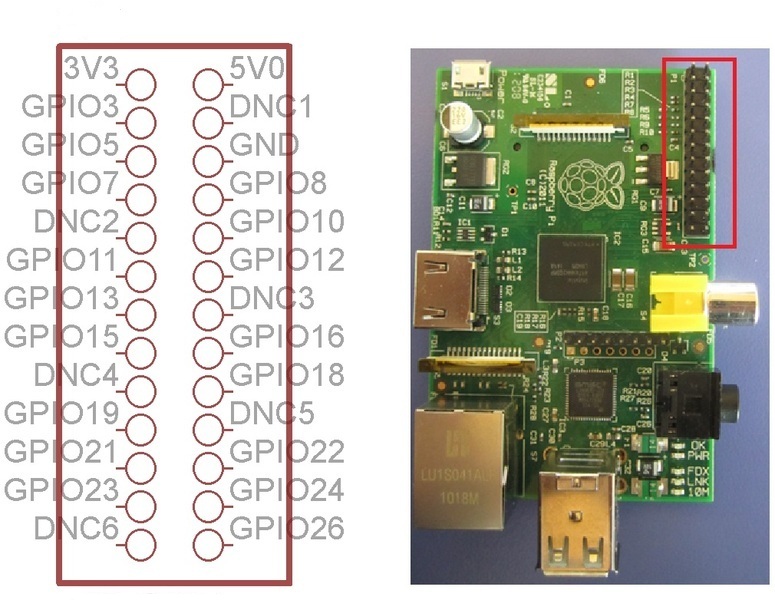
Pin Configuration
From- http://www.cl.cam.ac.uk/projects/raspberrypi/tutorials/turing-machine/two.html
GPIO pins can be configured as input pins and detect values or as output pins and set the value as high or low. Basically there are 26 pin comprises of one 3V (3.3V) pin, one 5V pin, one GND (0V) pin, six DNC (do not connect) pins and seven GPIO pins.
First and foremost, GPIO needs to be updated and upgraded. This process could take a bit of a time. However since this has already accomplished under section one, all there is to do is to double check whether version of the GPIO is correct. Therefore it is recommended to run a version test.
The version test code is as follows
Imort RPi.GPIOasGPIO

Text = GPIO.VERSION

Print text
Once GPIO is been updated and upgraded the Raspberry pi is ready.
Interfacing a LED
Materials needed
- A Breadboard and jumpers wires
Method
First the LED and safety resistor are connected on the breadboard. Since pin GPIO 24 on Raspberry pi is used as the output pin which provides necessary voltage for the LED to switch on, it should be connected to the positive side on the LED using male/female jumper cable. When the status of GPIO 24 is high the LED will switch on and vice-versa. Then the remaining side of the safety resistor is connected to the GND pin on the Raspberry pi.

Circuit Diagram
Code
The code is as follows –
Import RPi.GPIO as GPIO       # Import the relevant module

GPIO.setmode(GPIO.BOARD)      # Set the mode of numbering the pins

GPIO.setup(24, GPIO.OUT)      # Setting  GPIO 24 an output pin

GPIO.OUTPUT (24, True)        # Setting the status of GPIO 24 high</pre>
For the LED to blink the code is as follows –
Import RPi.GPIO as GPIO

Import time

GPIO.setmode(GPIO.BOARD)

GPIO.setup(24, GPIO.OUT)

GPIO.OUTPUT (24, False)       # Setting the status of GPIO 24 low

While 1:

GPIO.output(24, True)

Time.sleep(1)

GPIO.output(24, False)

Time.sleep(1)
Interfacing a push button
Materials needed
- A Breadboard and jumpers wires
- Push button
- 10K resistor
Method
First pin 4 of the push button is connected to the 10K resistor on the breadboard. Then other side of the resistor is connected to the GND pin on the Raspberry pi. Pin 2 of the push button is connected to the 3V3 pin on the Raspberry pi. Since pin 22 is set as an input and used to read the status of the push button (whether the push button is pressed or not), it is connected to the pin 4 of the push button using male/female jumper cables. When the push button is pressed the status of the pin 22 will be high and vice-versa..
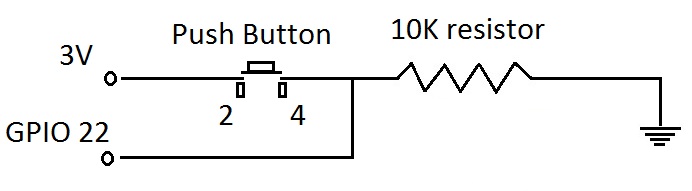
Circuit Diagram
To indicate the status of the push button a LED is used. Here the LED circuit is the same that has mentioned above. When the push button is pressed the LED switches on and when it is not pressed the LED remains off.
Code
Import RPi.GPIO as GPIO

GPIO.setmode(GPIO.BOARD)

GPIO.setup(22, GPIO.IN)   # Setting  GPIO 24 an input pin

while 1:

if GPIO.input(22):
 GPIO.output( 24, True)   # When the button switch is pressed, the LED is on
 else:
 GPIO.output( 24, False)  # When the button switch is not pressed, the LED is off
PWM with Raspberry pi
It is possible to dim a LED using PWM code. The following PWM code is written for the LED circuit mentioned above.
Code
import time
 import RPi.GPIO as GPIO
 GPIO.setmode(GPIO.BOARD)
 GPIO.setup(24, GPIO.OUT)

p = GPIO.PWM(24, 50)             # to create a PWM instance pin no 24 and frequency is 50Hz
 p.start(0)                      # value for the duty cycle (0.0 <= duty cycle <= 100.0)
 try:
 while 1:
 for dc in range(0, 101, 5):
 p.ChangeDutyCycle(dc)           # dc is the new duty cycle
 time.sleep(0.1)
 for dc in range(100, -1, -5):
 p.ChangeDutyCycle(dc)
 time.sleep(0.1)
 except KeyboardInterrupt:
 pass
 p.stop()                        # to stop PWM

GPIO.cleanup()
Interfacing a temperature sensor
Under this part we built a circuit to connect the temperature sensor DS18B20 to the Raspberry Pi.
Materials needed
- A Breadboard and jumpers wires
- 4.7 K resistor
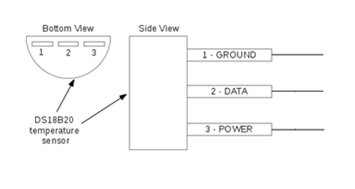
DS18B20 Pin Configuration
Method
The following circuit was mounted on a bread board. Pin 3 of the DS18B20 sensor was connected to the 3V3 pin of the AdaFruit connector which gives a voltage of 3.3 V. Pin 1 was connected to the Ground pin of the Raspberry pi. Then pin 2 of the sensor was connected to pin 4 of the AdaFruit connector. The 4.7 K resistor was connected in between pin 3 and pin 2 of the sensor.
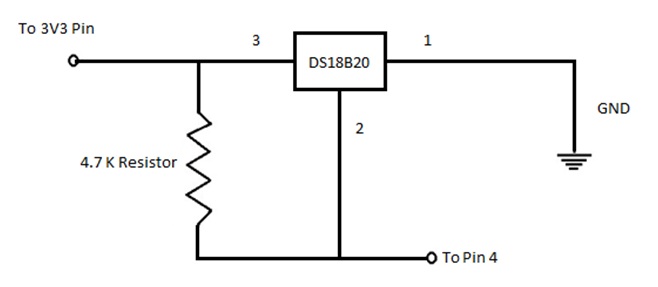
Temperature sensor Circuit Daigram
Code
The program was written to read the data from the sensor continually. Then when we press the Enter key, the temperature at that moment will be recorded in a data base. Finally the recorded data in the data base were extracted and displayed in the web page.
The following python code transfers the temperature data into the data base.
import time
import MySQLdb
#from time import gmtime, strftime
print "we are gonna put stuff in the database"
while 1:
        dummy = raw_input("Hit Enter to get current temperature and save in database
        con = MySQLdb.connect(host = "localhost", user = "root", passwd = "111g", db = "bugsbunny") ;
        cursor = con.cursor()
        tfile = open("/sys/bus/w1/devices/10-00080031ace2/w1_slave")
        text = tfile.read()
        tfile.close()
        secondline = text.split("\n")[1]
        tfile.close()
        secondline = text.split("\n")[1]
        temperaturedata = secondline.split(" ")[9]
        temperature = float(temperaturedata[2:])
        temperature = temperature / 1000
        print temperature
#       set = strftime("%a, %d %b %Y %H:%M:%S", gmtime())
#       print "",set
        cursor.execute("""INSERT INTO hansolo (temp) VALUES (%s)""",(temperatur) )
time.sleep(1)
 cursor.close()
 con.commit()
 con.close()
This is the php script used to extract data from the data base and display then on the web page.
<?php
mysql_connect("localhost", "root", "111g") or die(mysql_error());
mysql_select_db("bugsbunny") or die(mysql_error());
$data = mysql_query("SELECT * FROM hansolo")
or die(mysql_error());
Print "<h1>Practical Assignment</h1>";
Print "<table border cellpadding=3>";
Print "<th>ID</th><th>Time stamp</th><th>Temperature</th>";
while($info = mysql_fetch_array( $data ))
{
Print "<tr>";
Print "<td>".$info['id'] . "</td> ";
Print "<td>".$info['time'] . "</td>";
Print "<td>".$info['temp'] . " </td></tr>";
}
Print "</table>";</pre>
echo "
<!--
You are free to copy and use this sample in accordance with the terms of the
Apache license (http://www.apache.org/licenses/LICENSE-2.0.html)
-->
<!DOCTYPE html PUBLIC \"-//W3C//DTD XHTML 1.0 Strict//EN\" \"http://www.w3.org/$
<html xmlns=\"http://www.w3.org/1999/xhtml\">
<head>
<meta http-equiv=\"content-type\" content=\"text/html; charset=utf-8\"/>
<title>
Google Visualization API Sample
</title>
<script type=\"text/javascript\" src=\"http://www.google.com/jsapi\"></scri$
<script type=\"text/javascript\">
google.load('visualization', '1', {packages: ['corechart']});
</script>
<script type=\"text/javascript\">
function drawVisualization() {
// Create and populate the data table.
var data = google.visualization.arrayToDataTable([
['X', 'Temperature'], ";
mysql_connect("localhost", "root", "111g") or die(mysql_error());
mysql_select_db("bugsbunny") or die(mysql_error());
$data = mysql_query("SELECT * FROM hansolo")
or die(mysql_error());
while($info = mysql_fetch_array( $data ))
{
Print "[' " .$info['time'] . "', " .$info['temp'] . "],\n";
$catch = $info['temp'];
}
echo "
['', $catch]
]);
// Create and draw the visualization.
new google.visualization.LineChart(document.getElementById('visualizati$
draw(data, {curveType: \"function\",
width: 500, height: 400,
vAxis: {maxValue: 10}}
);
}
google.setOnLoadCallback(drawVisualization);
</script>
</head>
<body style=\"font-family: Arial;border: 0 none;\">
<div id=\"visualization\" style=\"width: 500px; height: 400px;\"></div>
</body>
</html>
";
?>
This is the end of section two. Next part is section three which comprises of details about the data base of the weather station.
Discussion
Here, a database was created before hand using phpmyadmin. To access the phpmyadmin through a different a computer or in other words, to remotely access the raspberry pi, the proxy settings has to be properly set (topic addressed thoroughly in the setting up of raspberry pi section).
Upon pressing the enter key, the temperature is measured using the temperature sensor and the data is immediately sent to the database and recorded along with the time stamp. Instead of pressing the enter key the raspberry pi can be set to automatically record the data by setting it to send data in a periodic time gap.
The method used here for one wire communication is not applicable for all one wire devices. The library used here is only specific to the DS18B20 temperature sensor. In other words, the reader should not make the mistake of thinking of the raspberry pi as some sort of plug and play module for one wire devices. It does not work that way.
Updating and upgrading the gpio takes a very long time for the raspberry pi. Therefore it is advised to update the gpio about once in two weeks, if you are using the most upto date libraries.
The output chart was created using google charts API.
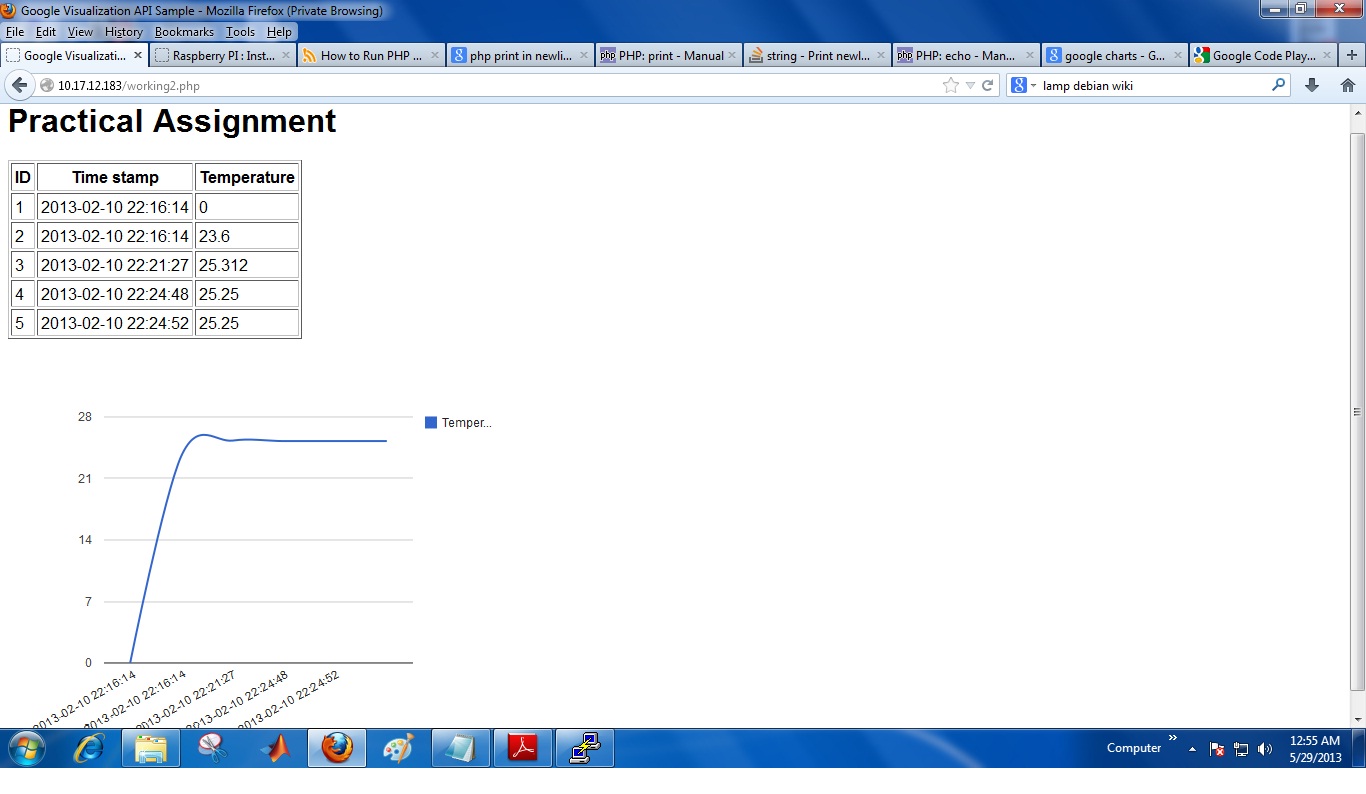
Final output