
Eazy-to-use Function Plotter
ezplot is designed to plot functions that has been entered as a string or function handle. It will be plotting a function over the default domain -2π < x < 2π, if we use f(x) type function. Or it will be plotting over the default domain -2π < x < 2π and -2π < y < 2π, if we use f(x,y) type function. Other than f(x) or f(x,y) functions, it will not be able to plot any other functions.
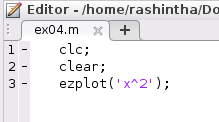
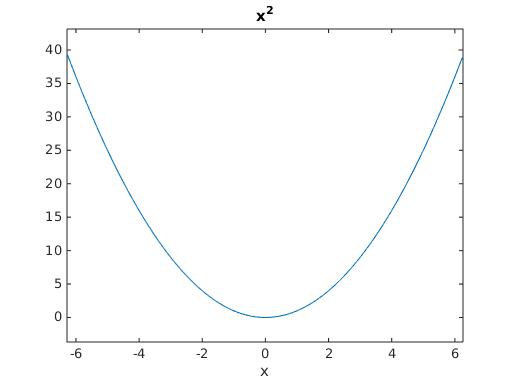
In here we’re going to use only string method. Now let’s plot a simple function f(x) = x2
ezplot(‘x^2’);
When you run the script, you will get a figure like follows.
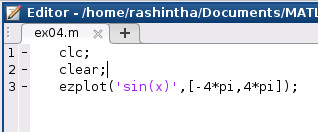
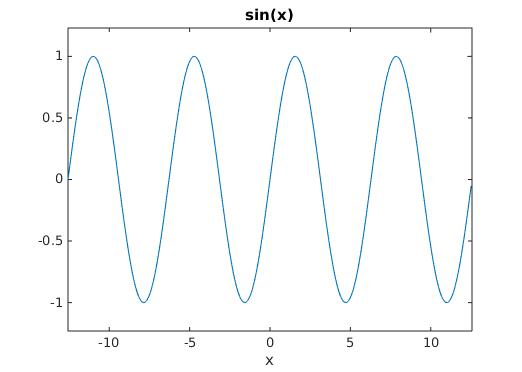
Now let’s change the default domain of a graph. Let take sin(x) graph over -4π < x < 4π domain. For that you could use following method.
ezplot(‘f(x)’, [x_min, x_max]);
Eg: ezplot(‘sin(x)’,[-4*pi,4*pi]);
Try yourself:
Since you have learned trigonometric and logarithm functions in previous session, plot them in different ranges as you wish. Also plot different angles such as 2x, 3x.
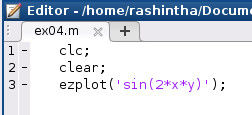
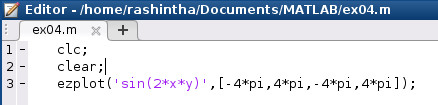
Now let’s plot f(x,y) = sin(2xy)
ezplot(‘sin(2*x*y)’);
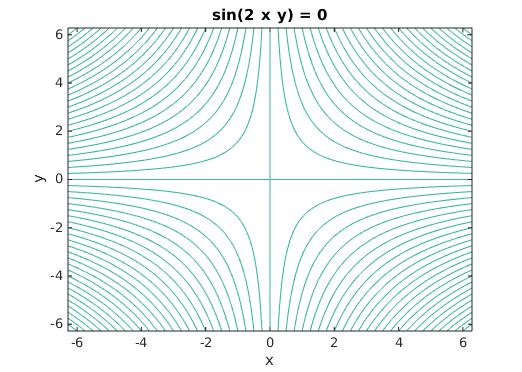
Now let’s change default domain of the graph to -4π < x < 4π and -4π < y < 4π. You could do that by using following method.
ezplot(‘f(x,y)’, [x_min, x_max, y_min, y_max]);
Eg: ezplot(‘sin(2*x*y)’, [-4*pi,4*pi,-4*pi,4*pi]);
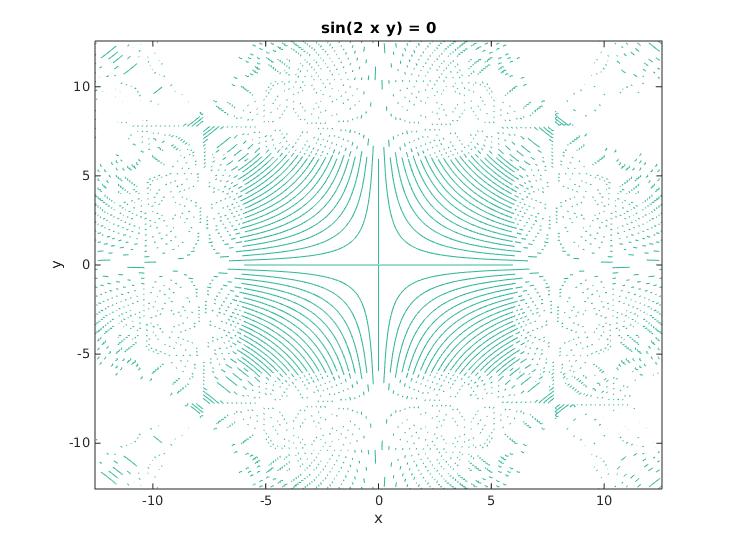
OK you will get a funny graph after plotting here. But the important thing is how to change the default domain. Now you know how to do that.
Try yourself:
Since you know how to plot f(x,y) type graph in any domain, try to plot some graph as you wish.
If you have ideas to improve this article, please comment them here or email them to FOS Media.