An energy diagram is a schematic representation of the energy changes that occur as reactants are converted into products. An energy diagram is comprised of several components. Consider the following energy diagram for a general concerted exothermic reaction;
A + B → C + D
Here A and B are the reactants whereas C and D are the products of the reaction taking place.

The vertical axis of the energy diagram is a representation of the total potential energy of all the species involved in the reaction. The horizontal axis symbolizes the reaction coordinate which indicates the progress of the reaction, as the reactants are converted to products going from left to right. The transition state is the highest point on the graph and corresponds to an energy maximum. The activation energy or Eₐ is the energy difference between the reactants and the transition state. The difference in energy between the reactants and products is the heat of reaction or the enthalpy change of the reaction and is symbolized by ∆Hº.
In an energy diagram, the reactants and products should be marked at the respective positions as given in the above diagram. The reaction shown above is an exothermic process, therefore the products are having lower energy than the reactants. In an endothermic process, the products will have higher energy than the reactants.
The activation energy is the minimum kinetic energy that the molecules must have in order to overcome the repulsions between their electron clouds when they collide. The value of the activation energy is always positive and its magnitude is dependent on the relative energy of the transition state. The term, “transition state” implies the transition from reactants to products, and the molecules can either go on to form the products or return to reactants.
A transition state is highly unstable and can never be isolated. The transition state is not an intermediate, as an intermediate is a species that exists for some finite length of time, even if it is very short. An intermediate has at least some stability, whereas, the transition state is transient on the path from one intermediate to another. The transition state symbolized is by the superscript ‡ symbol, which is called a superscript double dagger. The transition state for the SN2 reaction of an alkyl halide to form an alcohol is as follows;
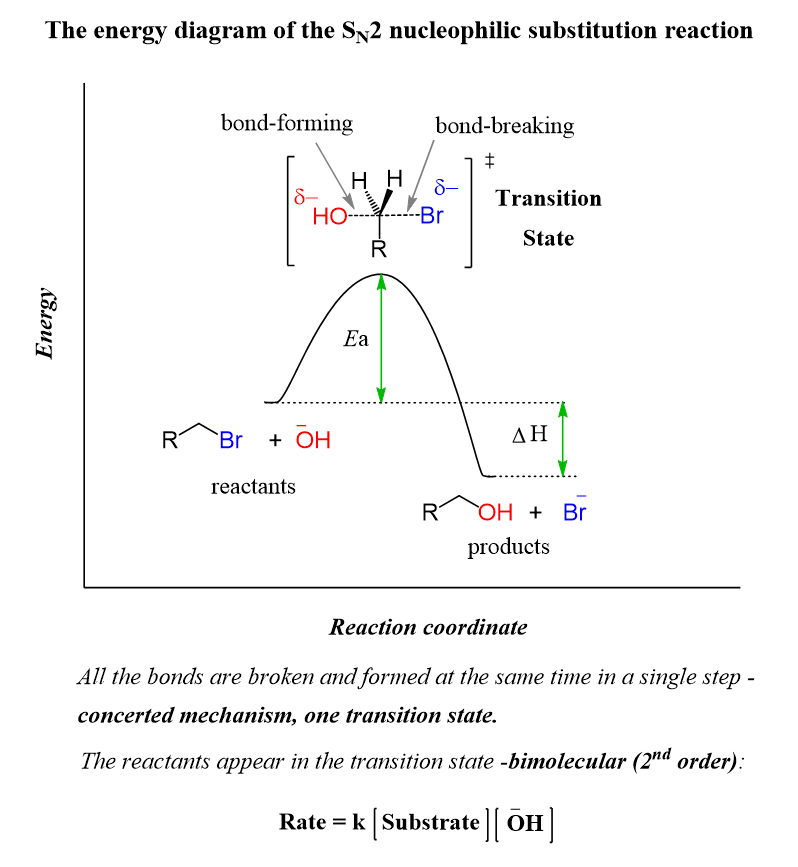
In the transition state, the nucleophile which attacks the alkyl halide and the leaving group both are allocated a δ- charge; as the attacking nucleophile is negatively charged and the leaving group obtains a negative charge once the bond is cleaved. The bond formation and bond breaking are indicated by dashed lines and the shape is trigonal bipyramidal.
Most reactions consist of several steps and involve the formation of multiple intermediate species. When considering such a multistep reaction, each step has its own characteristic rate. However, there can only be one overall reaction rate and the step which determines the overall reaction rate is called the “rate determining step” or “rate limiting step”.
Given an energy diagram, the rate determining step can be identified since the highest point in the energy diagram corresponds to the transition state with the highest energy which is the transition state of the rate determining step.
An energy diagram can be drawn for each individual step of a multistep reaction and by the combination of the separate energy diagrams drawn the energy diagram for the overall reaction mechanism can be formed.
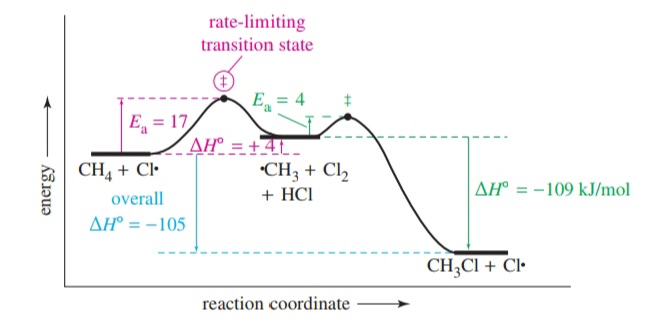
The energy diagram shown above is the combined energy diagram for the chlorination of methane. Each step of the multistep reaction has its own characteristic transition state, activation energy, and enthalpy change. The overall enthalpy change of a multistep reaction is the difference between the energy of the reactants and the final products.
The study of concepts such as transition state and activation energy is made more feasible graphically. Energy diagrams are therefore an important aspect of organic chemistry as they are beneficial in understanding the thermodynamics and kinetics of an organic reaction.
References and Images
- Organic Chemistry (8th Edition) by L. G. Wade Jr – Whitman College
- https://chem.libretexts.org/Courses/Purdue/Purdue_Chem_26100%3A_Organic_Chemistry_I_(Wenthold)/Chapter_05%3A_The_Study_of_Chemical_Reactions/5.7.%09Potential_Energy_Diagrams_for_Chemical_Reactions/Energy_Diagrams
- Feature Image: https://www.pinterest.com/pin/868772584346563390/
- Image 01: Organic Chemistry (8th Edition) by L. G. Wade Jr – Whitman College
- Image 02: https://www.pinterest.com/pin/614248836663294936/
- Image 03: Organic Chemistry (8th Edition) by L. G. Wade Jr – Whitman College
Featured Image Courtesy: http://bit.ly/3JsTIWB