
Right off the bat, I disclaim that this is not a piece on self-help or motivation, although we will “motivate” (pun intended :p ) a certain kind of thinking and understanding of a topic. That being an exceptionally useful set of methods in Statistics, a fundamental approach to reaching a conclusion when only a portion of the required data is available.
Often, we need to measure a quantity regarding a large group but due to time, financial and other constraints, data is collected only from a small subset of it. The large group is called the population and the small group taken from it is called a sample. We can obtain a conclusion from the group’s data and generalize it to the whole main group. That process is called Statistical Inference. In particular, let us explore the concept of the confidence interval and how it is used to make an inference.
Close enough…
Often when the exact value of a population parameter is unknown, we have to find a good approximation for it using the available sample data. Such an approximation value is called an estimate for the true population parameter.
The Central Limit Theorem states that, with a sufficiently large sample size (n > 30 usually), the distribution of sample means will be approximately normally distributed regardless of the shape of the population with a mean of μ and a variance of σ2/n.
Hence, we consider the sample mean to be a suitable estimate for the population mean μ. This fact will be of great use hereafter.
Claiming with confidence…
To say that estimate ± margin of error is a 100(1 – α)% confidence interval for the population parameter is to say that, if we repeatedly draw random samples and construct an estimate ± margin of error interval for each of them (based on the estimate value of that sample), 100(1 – α)% of these intervals capture the real population parameter. This corresponds to a 100(1 – α)% probability that the true population means would be contained in any one of those intervals that we choose.
In essence, a confidence interval is a range in which the population parameter is likely to be found in.
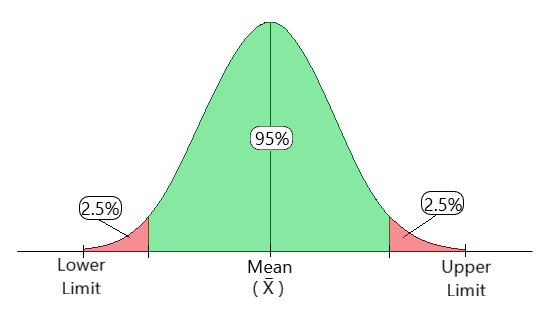
So, if we estimate the population parameter using a known sample from the population, we can construct an interval where we can be confident up to some level, that the real population parameter will be found in it.
Inferences can be made about the population mean, population variance, ratios of two different population variances, differences in two population means and more. Here we will see the simplest case of a confidence interval for a single population mean when the population variance is known.
Confidence Intervals for population mean when population variance is known
Often in practice, 95% confidence intervals are used, so the 100(1 – α)% = 95%. To say that x̄ ± k is a 95% confidence interval for the population mean μ is to say that, if we repeatedly draw random samples and construct an x̄ ± k interval for each of them (based on the x̄ value of that sample), 95% of these intervals capture μ. In other words, any one of those intervals has a 95% probability of containing μ.
If we know the mean of one sample from the population, then we can calculate an interval around it that has a 95% probability of capturing the population mean.
Moore, D. S., Notz, W., & Flinger, M. A. (2013). The Basic Practice of Statistics. W. H. Freeman
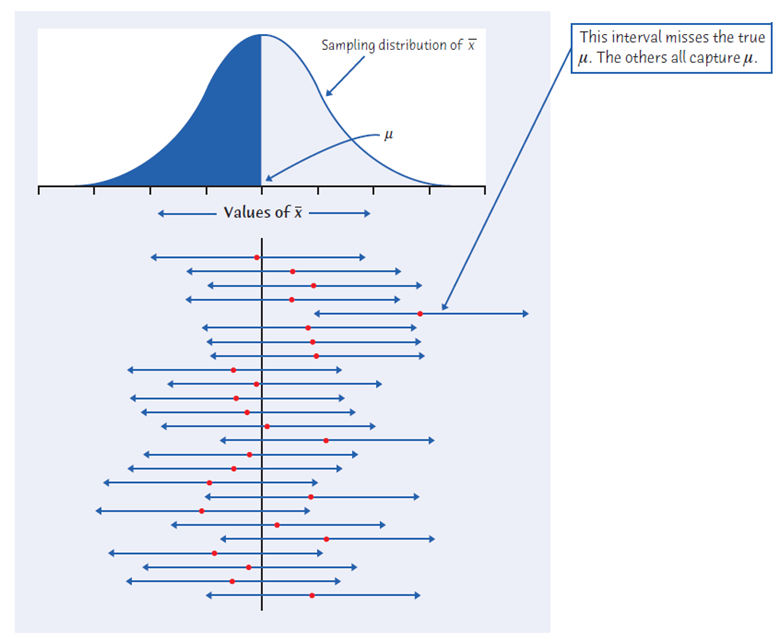
Not only the observations (X), but even sample means (x̄) are normally distributed. The central black line shows the population mean µ. Red dots are some specific sample means. The intervals around them are constructed by the rule x̄ ± k. Each one of them has a 95% probability of containing µ, i.e., they would all be 95% confidence intervals for µ.
Consider the following example from one of the references:
The National Institute of Standards and Technology (NIST) supplies “standard materials” whose physical properties are supposed to be known. For example, you can buy from NIST an iron rod whose electrical conductivity is supposed to be 10.1 at 293 Kelvin. (The units for conductivity are micro siemens per centimeter. Distilled water has conductivity 0.5.) Of course, no measurement is exactly correct. NIST knows the variability of its measurements very well, so it is quite realistic to assume that the population of all measurements of the same rod has the Normal distribution with mean equal to the true conductivity and standard deviation 0.1. Here are 6 measurements on the same standard iron rod, which is supposed to have conductivity 10.1:
10.08, 9.89, 10.05, 10.16, 10.21, 10.11
NIST wants to give the buyer of this iron rod a 95% confidence interval for its true conductivity. What is this interval?
By the above definition of the confidence interval, we need to find an interval around an estimate for the population mean, corresponding to 95% confidence. Firstly, must we find an estimate for the population mean. It is known that the sample mean is a suitable estimate for population mean, hence we will find that using the sample data given.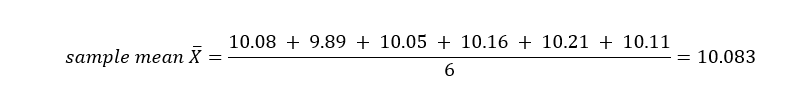 Now since the sample mean is a suitable estimate for population mean, the population mean µ = 10.083.
Assuming that sample means (x̄) are normally distributed with variance σ2/n for population variance σ2 and sample size n, it can be shown that x̄ ± Zα/2 σ/√n is a 100(1- α)% confidence interval for the population mean µ.
Here, 100(1- α)% is the confidence level and Zα/2 is the value in the normal probability table that corresponds to a probability of 100(1- α)% (also called the critical value).
By the given information, σ/√n = 0.1/√6 = 0.0408. Since the required 100(1- α)% = 95%, α = 0.05. The critical value Zα/2 = 1.96 is found from the standard normal table.
Then a suitable 95% confidence interval would be x̄ ± Zα/2 σ/√n = 10.083 ± 1.96 * 0.0408
Or, 10.08 ± 0.08
We conclude that we are 95% confident that the true conductivity (mean of the population) falls inside the range 10.08 ± 0.08.
How to be confident…
When the exact population parameter is not known, we must resort to estimating it using sample data. Knowing a confidence interval helps to gauge the accuracy of an estimate. In fact, the presence of the supposed population mean within the confidence interval is often taken as enough evidence for making a decision. This is one approach to testing a hypothesis. Higher confidence levels correspond to a larger margin of error, in which case we allow for a larger room for the decision to be right. By selecting a suitable confidence level and following the relevant methods, one can make the needed decisions efficiently and confidently.
References:
Moore, D. S., Notz, W., & Fligner, M. A. (2013). The Basic Practice of Statistics. W. H. Freeman.
Image Courtesy:
Cover image : https://bit.ly/43il8Gb
Content Image 1: https://bit.ly/3qkGwMe